What this feature does
A live search in Monitor only collects posts from the moment it starts. Historical data requests let you pull in X posts from the past for an existing search. Typical uses:
- Catch chatter a live search missed.
- Investigate an incident after the fact, for example something that happened over the weekend.
- Test how noisy a keyword is before turning it into a live monitor.
- Find out who talked about or shared something first.
Retrieved messages appear in your normal message feed, so you can filter, review and work with them as usual.
This feature draws from your existing X quota.
Who can use it
| Action | Who |
|---|---|
| Request historical data | Advanced users and above |
| View Query history | All users on the case |
| Work with the collected messages | All users on the case |
Where to find it
Open More in the search header (next to Exclude). It contains two new options: Request historical data and Query history.
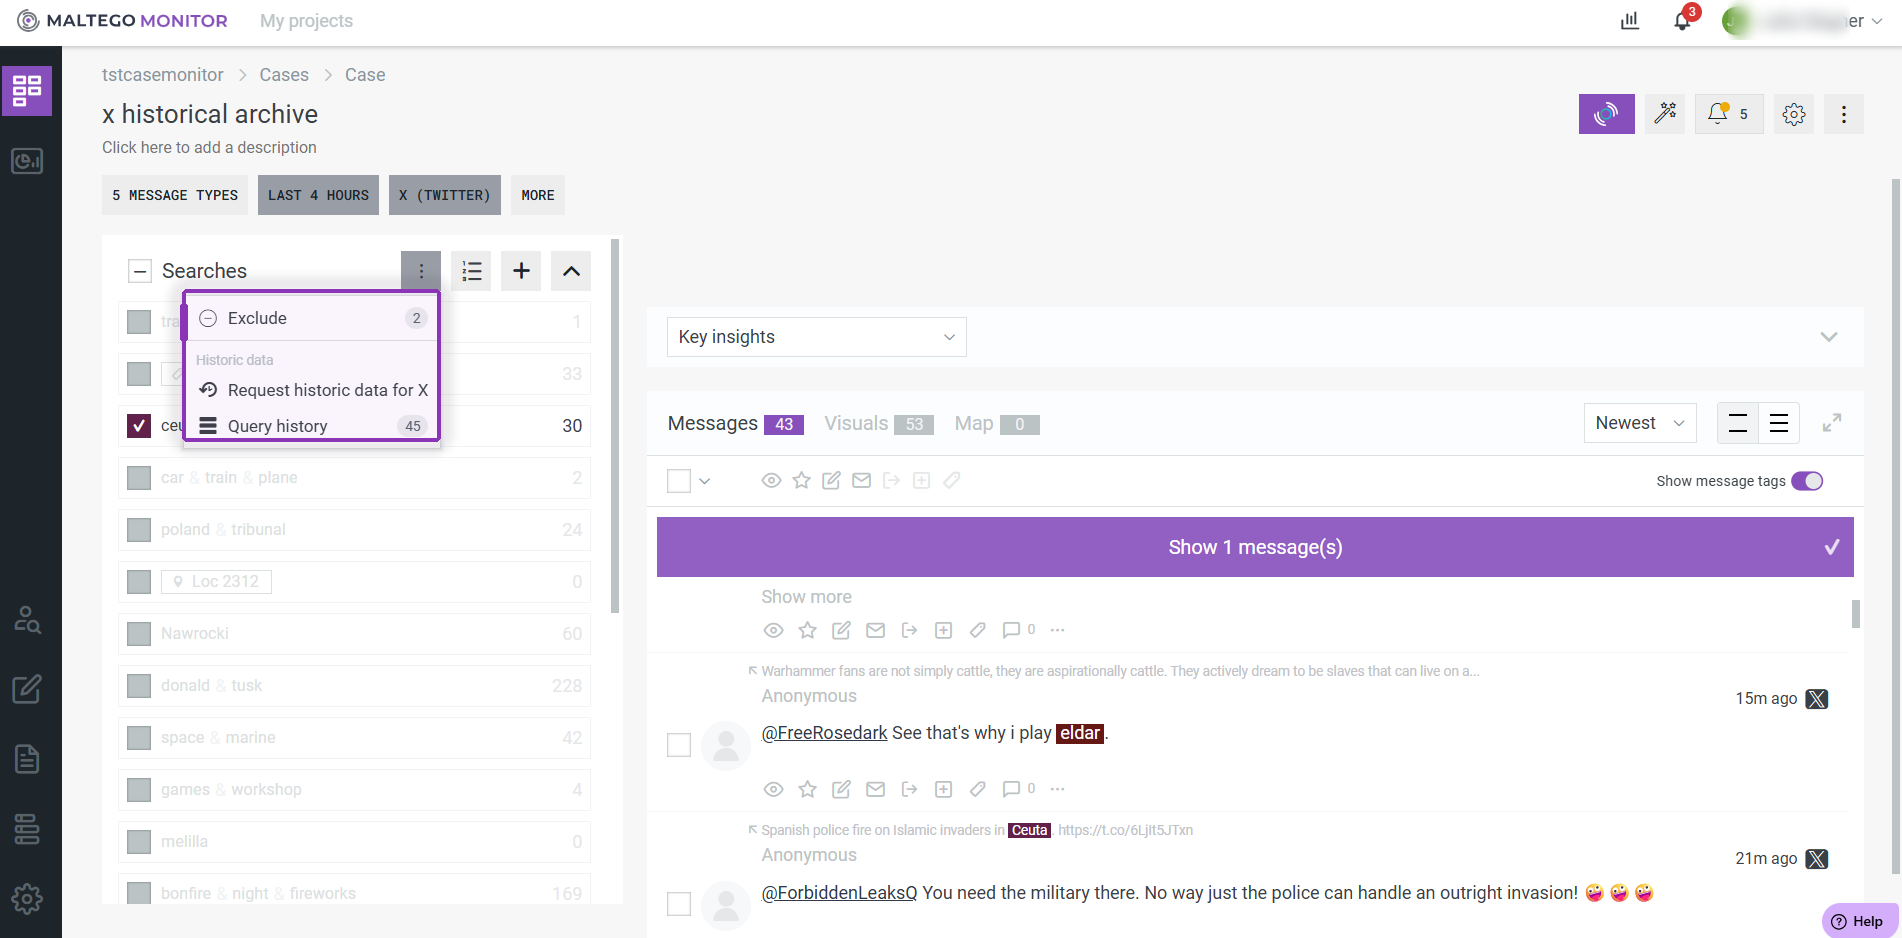
Figure 1. Click More, then choose Request historical data or Query history.
If the case has no search yet, you are asked to create one first.
Request historical data
- Open More > Request historical data.
- Select searches. Tick one or more existing searches on the case. At least one is required.
- Choose a time range. Use a preset (for example last 24h, 7d, 30d, 90d) or set a custom start and end.
- Check the frequency chart (optional). The chart is closed by default. Open it to see estimated message volume over time, spot spikes, and narrow your range to the period you care about.
- Review the estimate. Before submitting, you see the estimated number of messages the request will return. Narrowing the range updates the estimate.
- Submit.
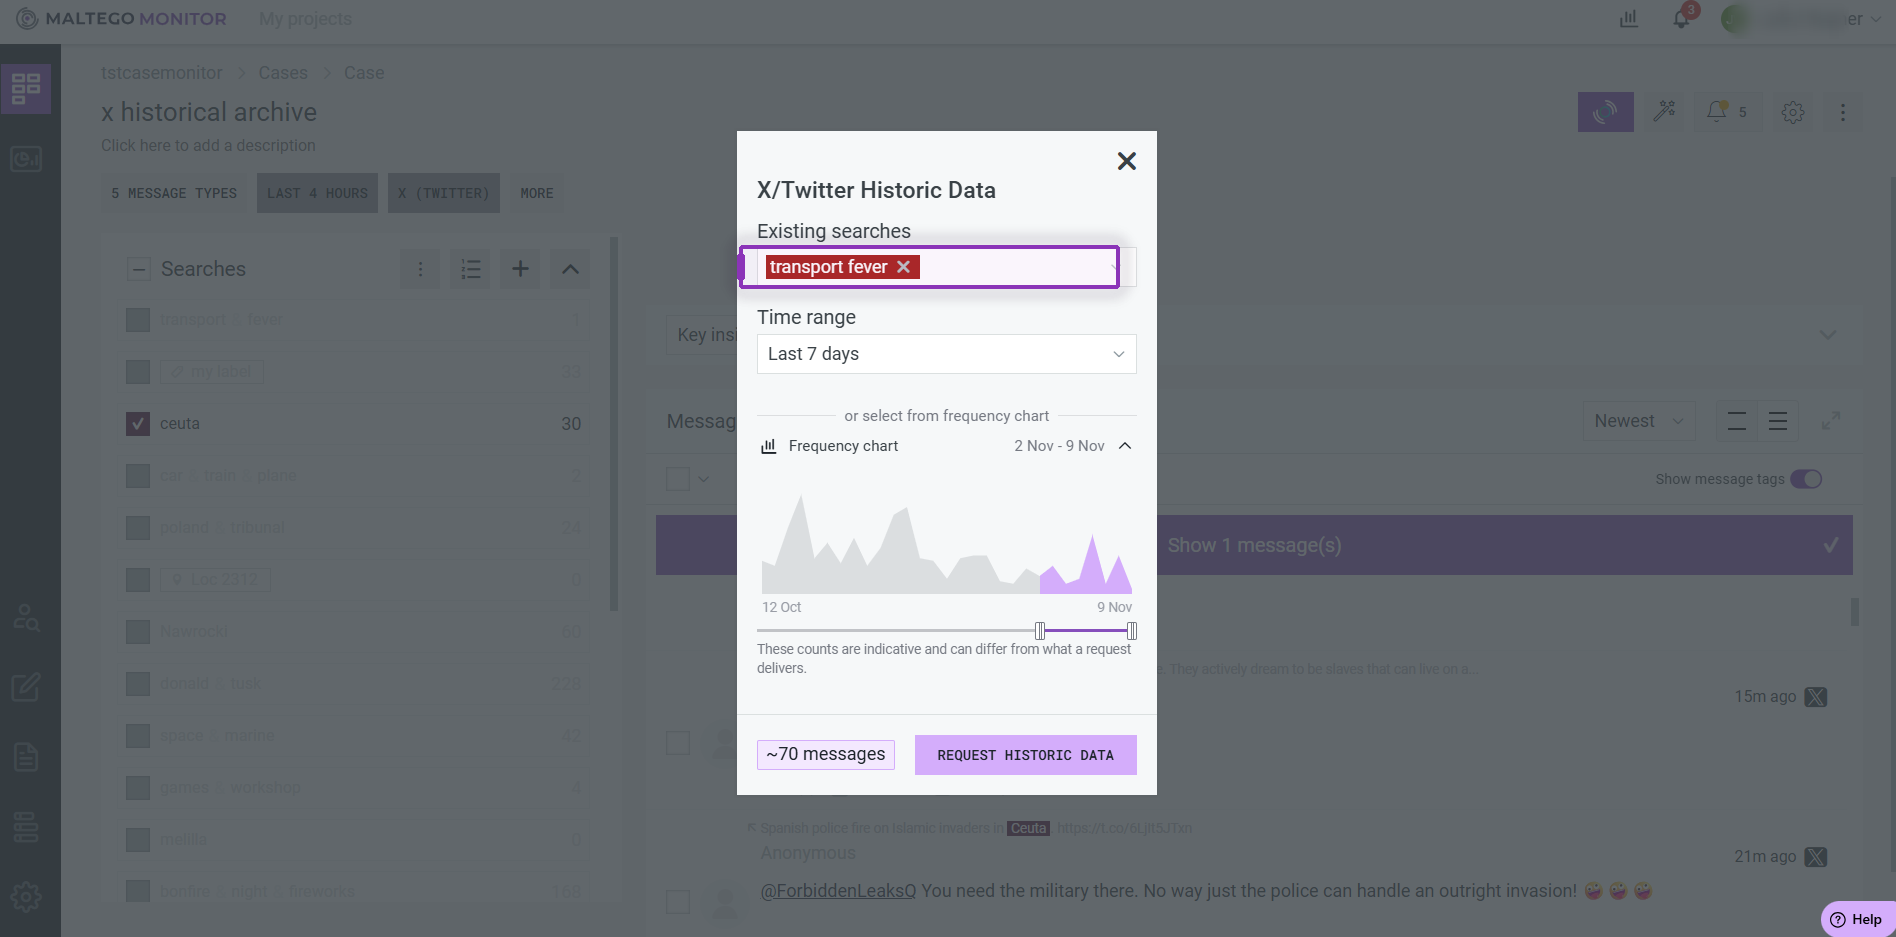
Figure 2. Select exisitng searches via drop-down, set the time range, (optionally) open the frequency chart to refine around a spike, and read the message estimate.
Tip: look at the number of messages estimate before you submit. It is the main way to avoid collecting far more messages than you need.
What happens after the request completes
When a request finishes, Monitor applies it to the message feed automatically:
- Time range is set to the requested range.
- Source is set to X (Twitter).
- Search filter is set to the requested search(es).
- All other filters are disabled.
A banner above the feed shows how many messages were collected, with a one-click action to reset the filters. If the request fails, an error message appears there instead.
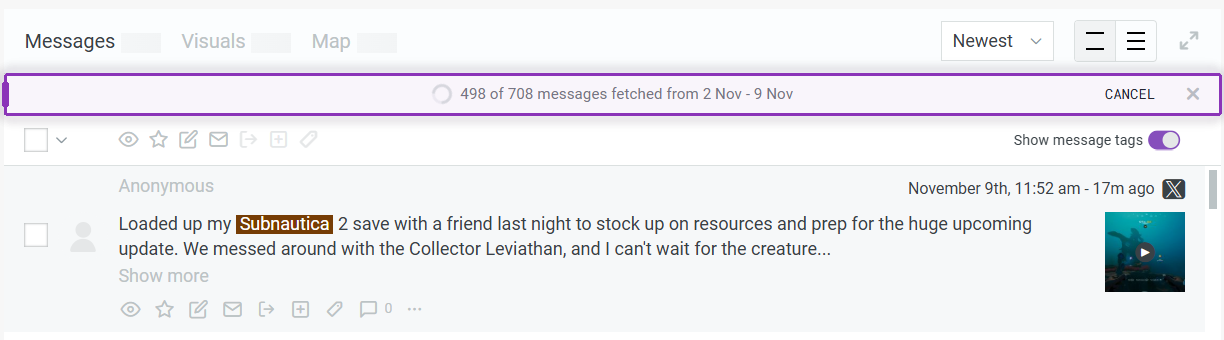
Figure 3. Check the banner for the collected message count and use its reset action to return to your normal filters.
Query history
Open More > Query history to see every historical request made on the case, most recent first. Select a request to load the data it returned into the message feed.
| Column | Meaning |
|---|---|
| Search name(s) | Searches included (hover to see long names in full) |
| Time range | Range configured for the request |
| Result | Number of messages returned |
| Source | Currently X only |
| Request date | When it was made |
| Requested by | Who made it |
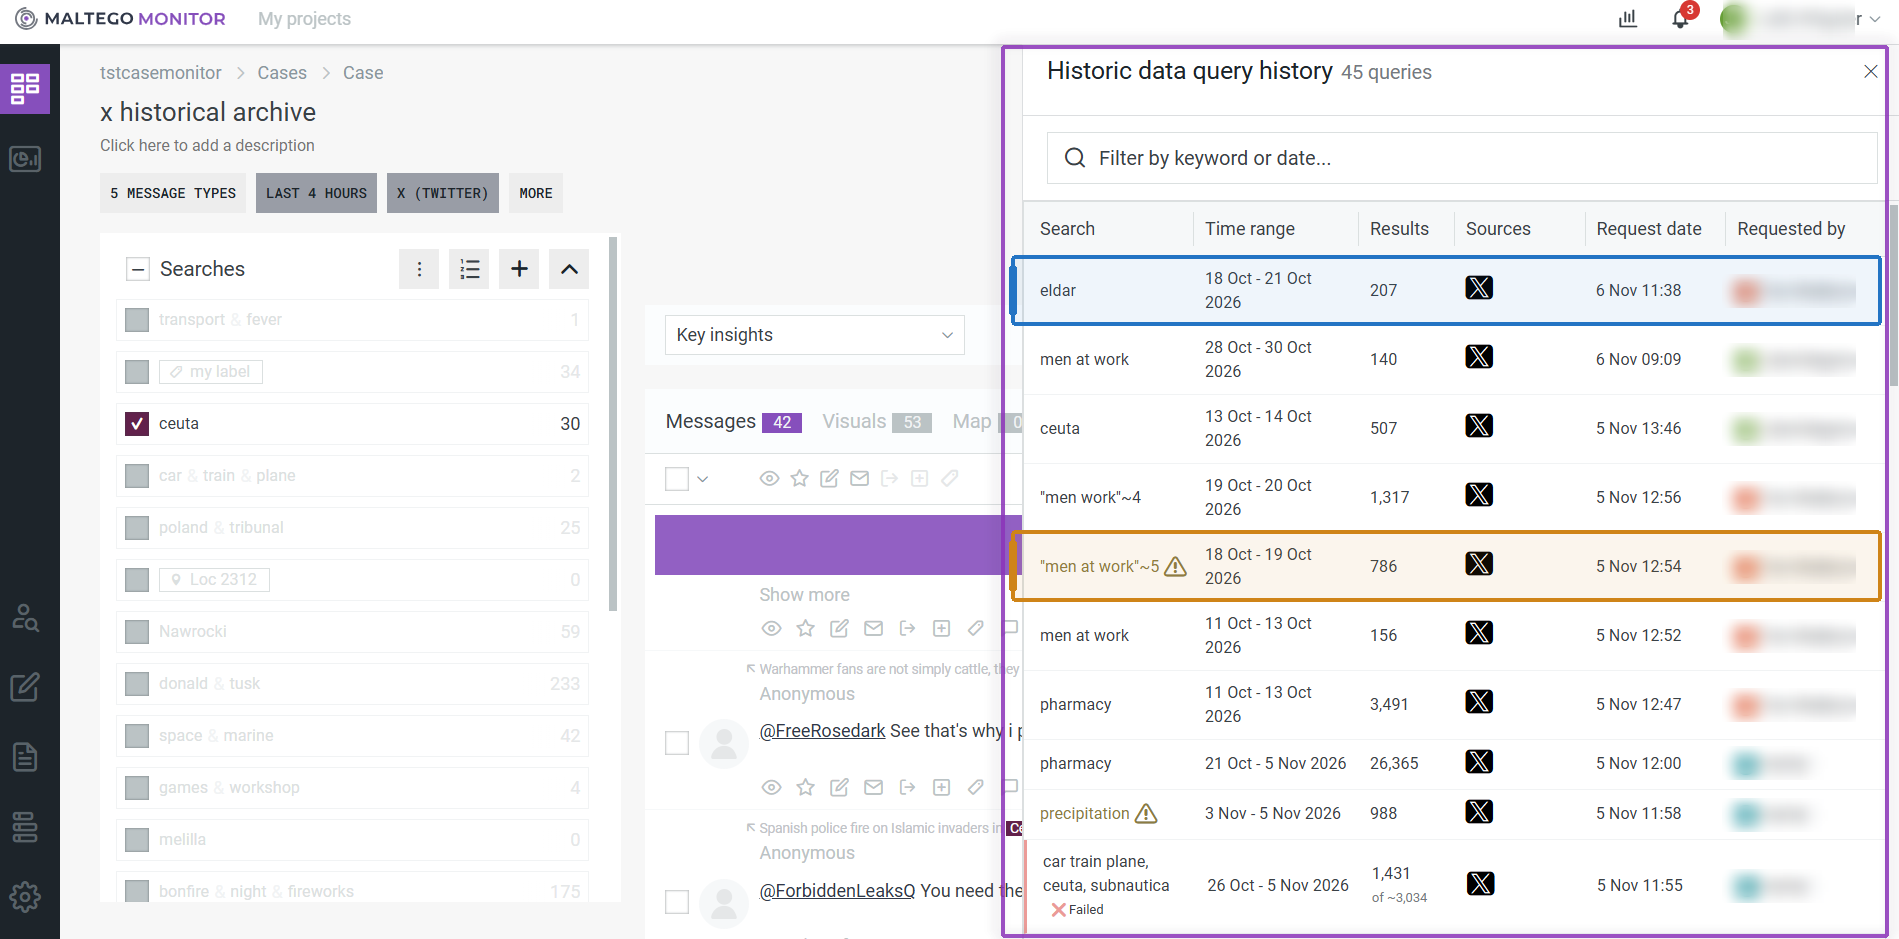
Figure 4. Review past requests in this side panel. It shows who requested when what and the associated cost (in messages). In addition it also informs you about successfull or failed requests.